NoiseKen - Electromagnetic Field Visualization System / EPS-02Ev3
- A real-time diagnostic tool supports EMC/EMI debugging.
- Fast visualize EMC/EMI problems.
- Enables easy comparison of countermeasures before and after.
- Capable of measurement from entire products to single components.
- Factor-editor function provides correction of antenna characteristics, cable loss and preamplifier.
- User friendly compact design.
- Customer supplied spectrum and probes acceptable (Please consult)
Three-Dimensional Indication (Time, Frequency, Amplitude) Simplifies EMC/EMI Debugging
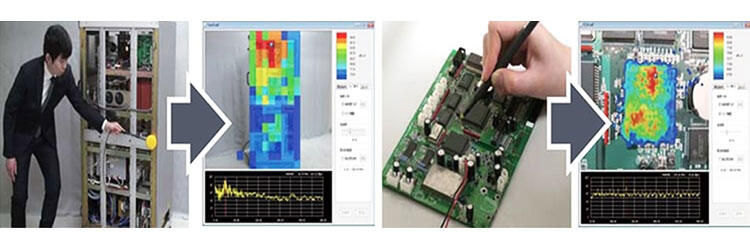
EPS is a EMC/EMI debugging tool enabling designers to rapidly perform pre-measurement, failure point identification, and improvement efficiency confirmation in EMC/EMI countermeasure process of product design. How does it work?
The software detects locations of probes by color discrimination through camera’s image sensors*, real time analysis measured signal frequency, shows a heat map by overlapping electromagnetic field strength and real images of measured objects.
Simplifies EMC/EMI Debugging Three-Dimensional Indication (Time, Frequency, Amplitude)

Specifications
|
Parameter |
Specification / Function |
|---|---|
|
Frequency Range |
100 kHz ~ 3 GHz *Depends on the electromagnetic field probe specifications (The above is for ETS probes) |
|
Measurement Unit |
dB μV、dBm |
|
Sensor / Probe |
φ 60 / 30 / 10 mm loop coil (magnetic field), φ 36 mm ball (electric field), φ 6 mm tip (electric field) Total 5 types *Depends on electromagnetic probe specifications (Probe by ETS-Lindgren) |
|
Probe Cable Length |
2m(N(P)-BNC(P) (Coaxial connector cable) |
|
Data Recording Method |
Single / Free Run /Max Hold / Max Peak Data* |
|
Auxiliary Function |
Save / load / export / comment input / factor re-read / camera image retake / up-down & right-left inversion of camera image / ghost display of camera image / Screen enlargement-reduction |
|
Compatible Operating System |
Windows 7 / 10 |
|
System Configuration |
Electromagnetic field probe (PN 7405) , BNC (P) -N (P) connector coaxial cable (02-00150A), Three Color Probe Head Cover (03-00111A), RF preamplifier (00-00019A), Spectrum analyzer, Control PC |
|
Accessories |
LAN cable, Camera, USB cable extension 2 m for camera, Tripod for camera, Software, USB protect key, Instruction manual |
*Peak Hold: Displays the trace data with the largest peak value from the trace data measured at each measurement point.
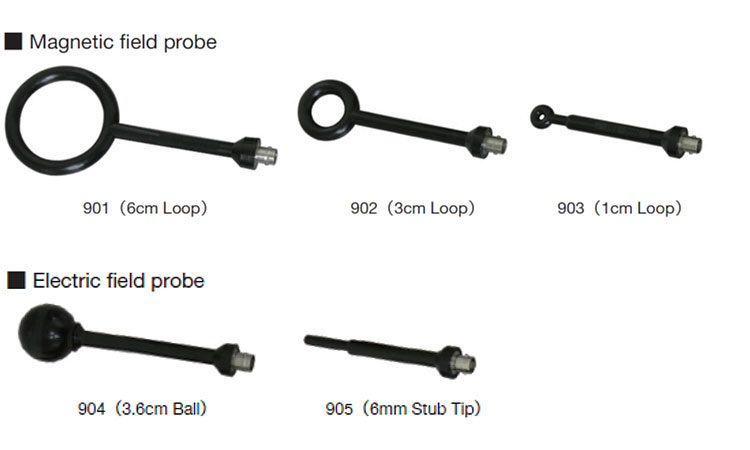
Electromagnetic Field Probe (PN 7405) Frequency Specialization
|
Model |
Type |
Electric Field / Magnetic Field |
Construction |
Recommended Frequency Range |
|---|---|---|---|---|
|
901 |
6 cm Loop |
Magnetic Field |
Sealed Loop |
3 MHz ~ 500 MHz |
|
902 |
3 cm Loop |
Sealed Loop |
5 MHz ~ 1 GHz |
|
|
903 |
1 cm Loop |
Sealed Loop |
10 MHz ~ 3 GHz |
|
|
904 |
3.6 cm Ball |
Electric Field |
Spherical Dipole |
10 MHz ~ 3 GHz |
|
905 |
6 mm Stub Tip |
Spherical Dipole |
50 MHz ~ 3 GHz |
More Product Information
- The DF242 is characterized as a Large Low Angle Dark Field ring light.
- Precisely aimed LEDs provide a very low angle of incidence, radial illumination pattern.
- A scratch on a sheet of glass is a good example of a defect that can be detected easily with a low-angle dark field illuminator.
- With a light intensity of 24kLux at a working distance of 1” (25mm), the DF242 is perfect for imaging problems with medium sized fields of view.
- A 35mm field of view is standard with optional fields of view of 45 and 70mm.
- Available in a range of wavelengths from UV to IR.
*Engineered to provide comparable optical characteristics to our previous RL1660.
- Part of the MicroBrite™ family of high performance, compact machine vision lights.
- Produces an intensity level of 41kLux (working distance of 180mm).
- Available in several sizes including 50mm, 100mm, 160mm and 200mm.
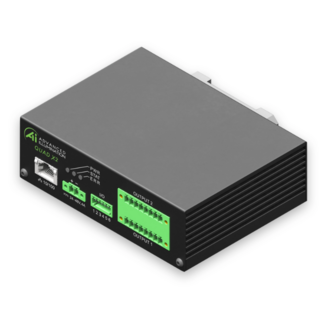
- 8 Independent Channels, 2 Output Connectors
- Includes built-in pre-programmed sequencing.
- Provides control for computational imaging, including photometric stereo, extended depth of field, combined bright field + dark field, high dynamic range, and high resolution color.
- Ideal for multi-channel lights and multi-light stations. Due to power output constraints, some configurable light lengths may be limited.
- Housed within a compact enclosure with DIN rail mounting.
- Driven with SignaTech™ for improved safety and easy operation.
NOTE: NOT COMPATIBLE WITH C1 CONNECTORS
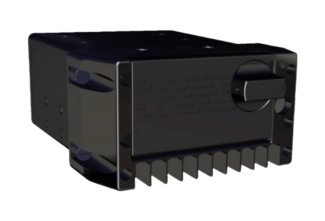
The NS1310 is a robust, compact data server and storage unit specifically designed for the challenging conditions of airborne environments.
This versatile system functions as a Network Attached Storage (NAS) unit and is equipped with a high-capacity Removable Memory Module (RMM).
The ENERTEC™ mission data processing and distribution units offer cost-effective and dependable solutions for field and mission data tasks, such as data acquisition, processing, storage, exploitation, and distribution. These units are suitable for use on both manned and unmanned ground, air, and sea vehicles. They undergo rigorous validation and formal qualification testing, adhering to standard test methods like DO-160 and MIL-STD-810.
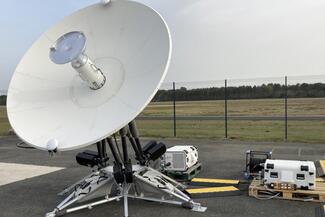
ARES (formerly IRIS) from Safran Defense & Space, Inc. (formerly Safran Data Systems, Inc.) represents the next-gen in transportable antenna systems. Packed in portable cases for easy handling, ARES can be shipped using standard methods and be fully operational in under an hour in the field, standing by to support satellites. Utilizing a reliable pedestal design and a dual-band concentric feed, ARES antenna ensures pinpoint accuracy and top-notch antenna performance. Crafted from standard (LRU) parts, it’s a breeze to maintain and service on-site, guaranteeing maximum uptime for all satellite missions. Combined with the SATCORE combo box (Command/Control modem & high-rate receiver) and the TM MAESTRO Monitoring & Control software, ARES is the all-in-one portable satellite tracking system.
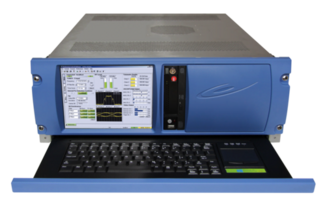
The RTR-X4 is one of the most advanced digital telemetry receivers on the market with its well-recognized RF performance and signal processing capability.
The 4U chassis-based RTR-X4 can support up to four channels providing flexibility and capability as well as a rich set of features for different frequency bands, modulations, decoders and output formats.
Not only does the CORTEX RTR provide an extensive set of features for different frequency bands, modulations, decoders and output formats, but the user can easily upgrade the equipment in the field to access additional and new features. The RTR-X4 is an excellent fit for flight test ranges, offering full flexibility and easy access to settings through its user-friendly GUI on the embedded 8.4-inch screen.
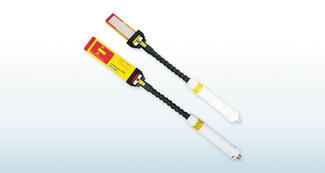
Thin plate broadband antenna has been developed for efficient immunity testing against hand-held transmitters and cellular phones. Many pieces of spot frequency antennas had to be used in turn thus fur. This new Thin-plate Broadband Antenna is a single antenna solution eliminating the need for antenna changes and dramatically reducing the test time. Furthermore, this antenna with its small-size and lightweight properties and a flexible handle is suitable for testing in narrow spaces.
-
A wide frequency range eliminating the need for antenna changes
-
30W maximum power input allows high filed strengths
-
High efficiency due to a low VSWR and high gain
-
Suitable for broadband digital modulation thanks to a good VSWR flatness
-
Small, light-weight and flat antenna easy to use in narrow spaces
-
Easy handling with a flexible arm
-
A wide radiation pattern makes directivity of the fields no longer an issue
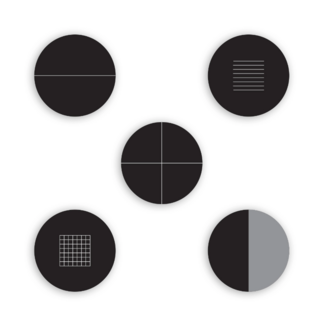
- For use with the SL256 Pattern Projecting Spot Lights
- Five field-replaceable standard patterns available
- 0.050mm line width photolithography
- Reticles include spanner wrench
- Please contact Ai for custom reticle patterns

-
Accommodates a combination of up to four Cascade Microtech probes
-
Configurable for mixed-signal RF/mmW testing
-
Quick and easy repairs to be performed in the field, by simply replacing individual probes
-
Adaptable to new device layouts by exchanging individual probes
NoiseKen
For over 40 years from its foundation in 1975, Noise Laboratory has been focusing on immunity test equipment and related solutions.
Now their product lines include various types of immunity test equipment ranging from those conforming to IEC 61000-4 series standards, other international or national immunity standards and even to customer's in-house test standards.
Contact Details
Shinyei Corporation of America Head Office - Sole Authorized distributor of NoiseKen products
1120 Avenue of the Americas, 4th Floor, New York, NY 10036, USA
Phone: 917-484-7884
Fax: 212-704-4206
Test & Measurement
Download Line Card